IPC Map
Author: Ahmed Farouk
The IPC Map is one of the five key maps in our project, leveraging the Integrated Food Security Phase Classification (IPC) framework. This framework categorizes population's regions into five phases based on the severity of food insecurity and malnutrition:
- Phase 1: Minimal
- Phase 2: Stressed
- Phase 3: Crisis
- Phase 4: Emergency
- Phase 5: Famine
This classification helps visualize and analyze food insecurity worldwide.
IPC Map Views
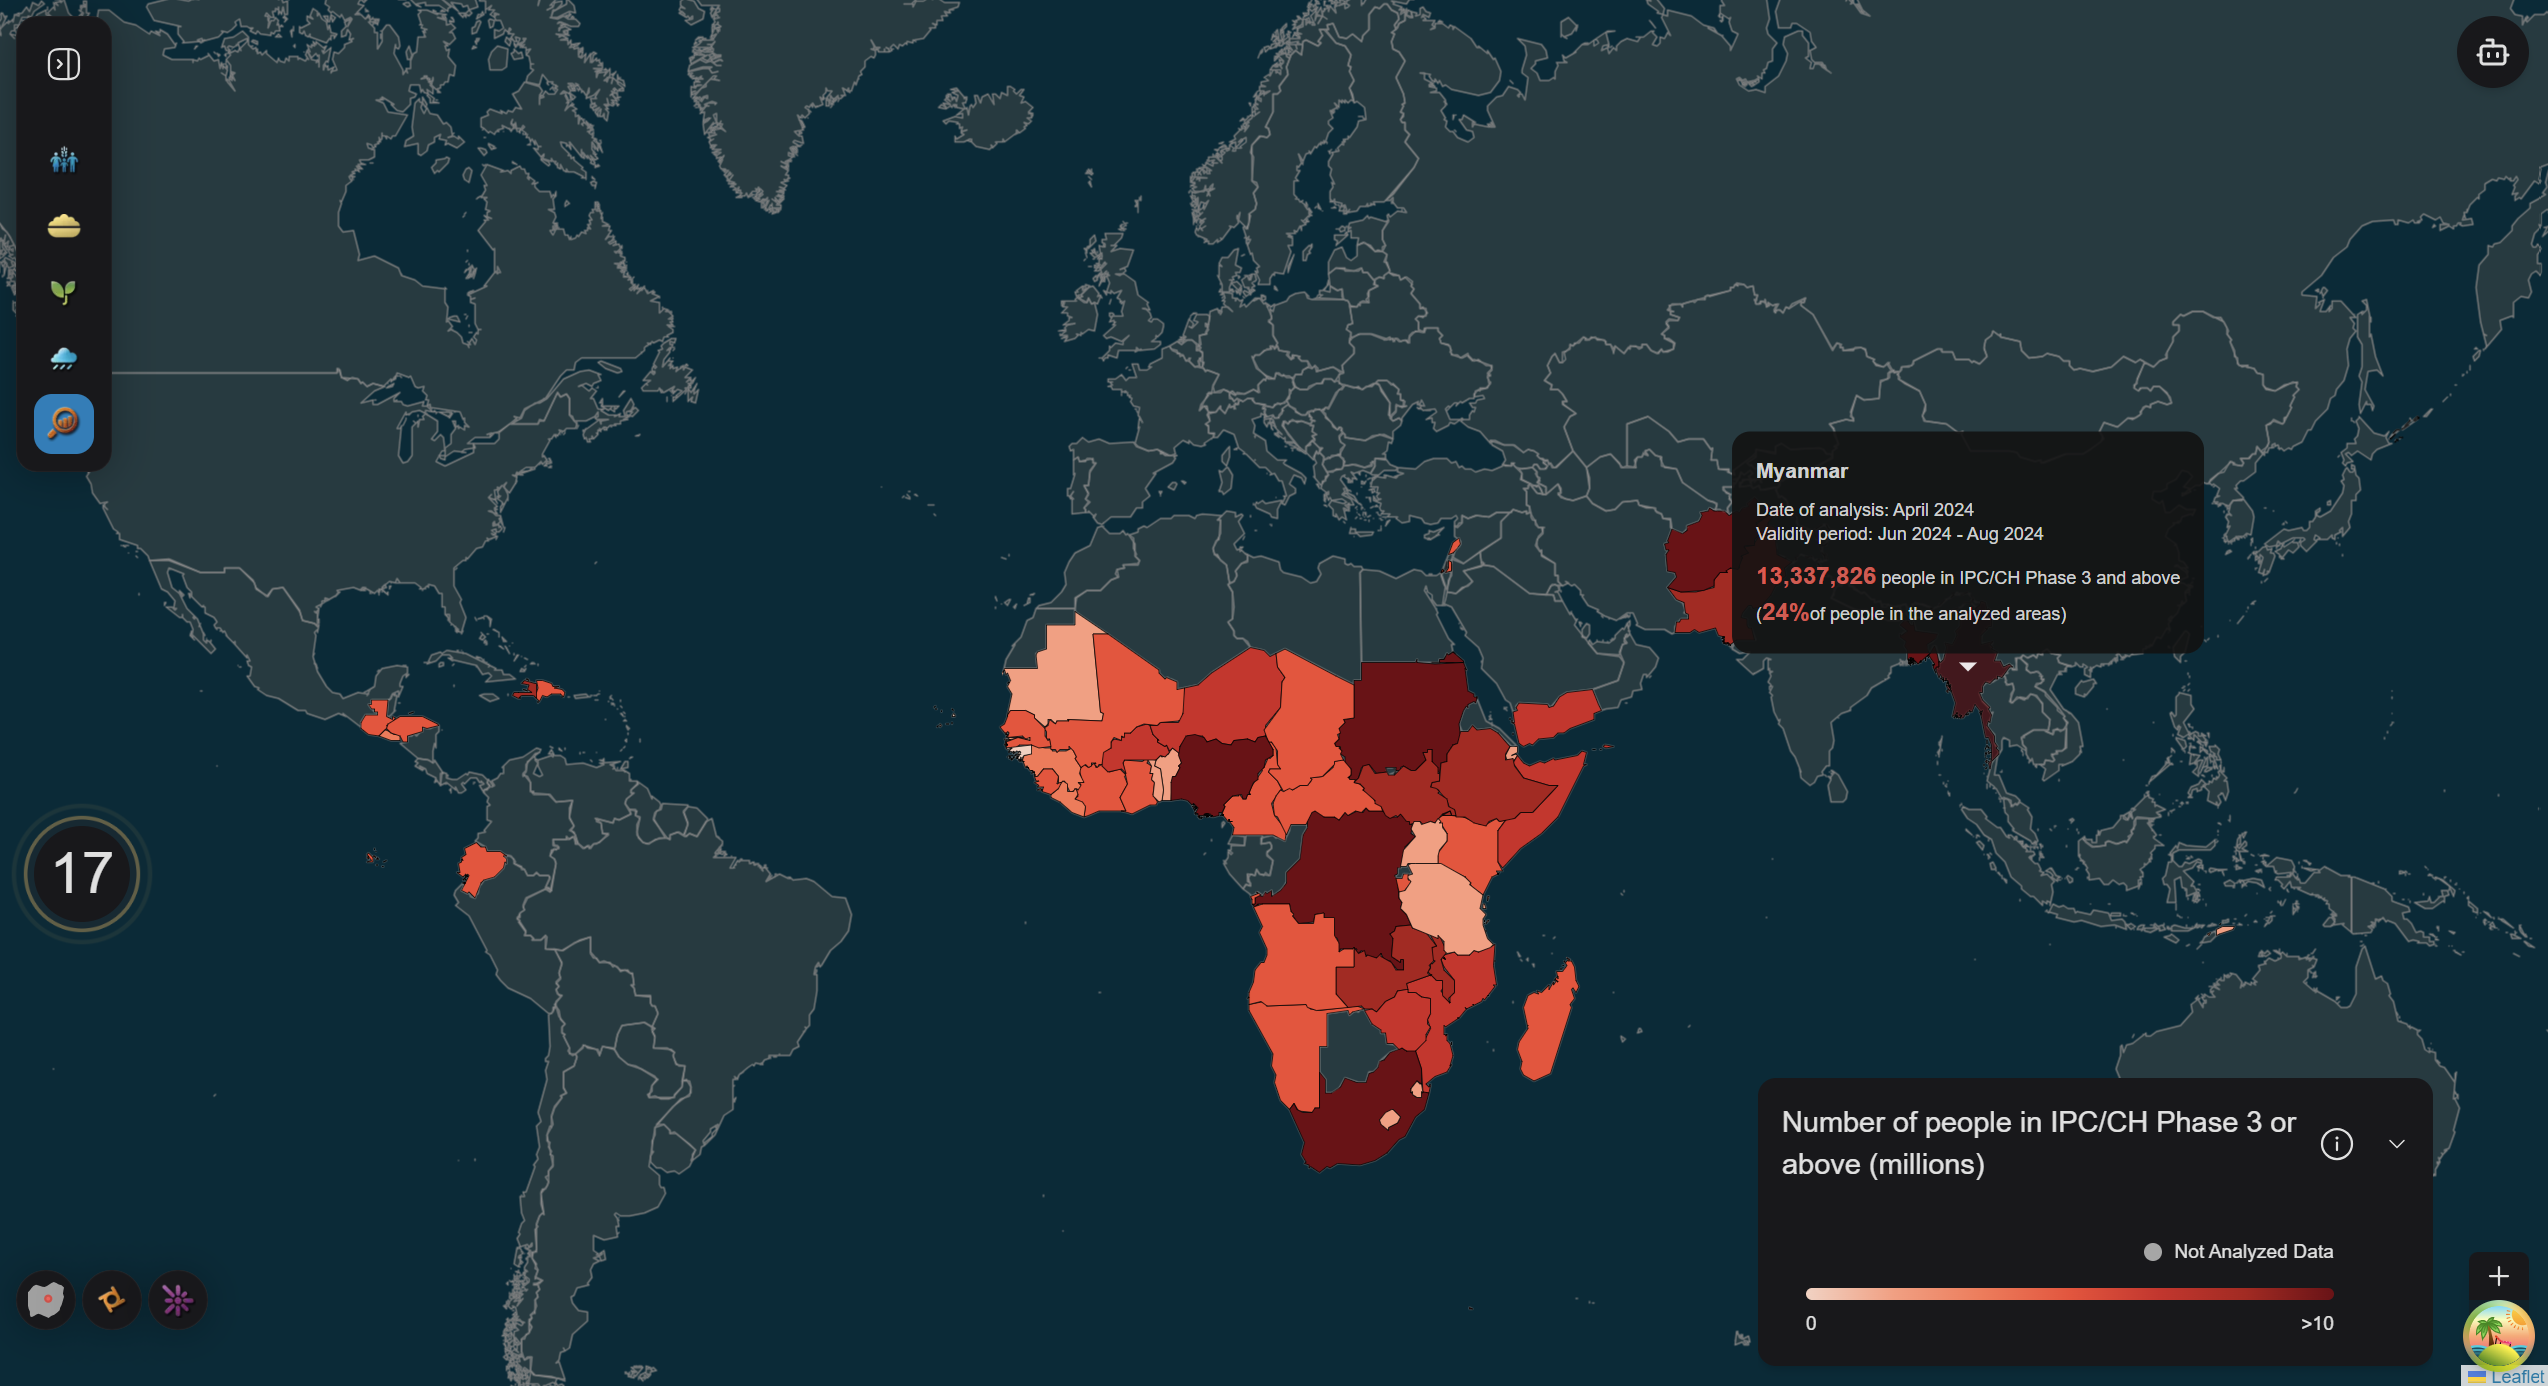
1. World View
This view is displayed when no specific country is selected:
- IPC data is visualized globally with red gradients indicating the severity of food insecurity and malnutrition.
- Countries without IPC data are shaded in gray.
- A gradient legend is displayed, showcasing the number of people in Phase 3 (Crisis) and above, measured in millions.
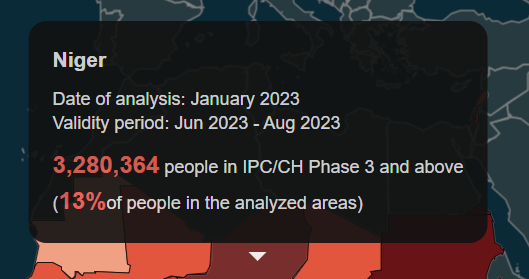
- Hovering over countries triggers a tooltip that includes:
- Country name.
- Date of analysis.
- Validity period.
- Number and percentage of people experiencing severe food insecurity.
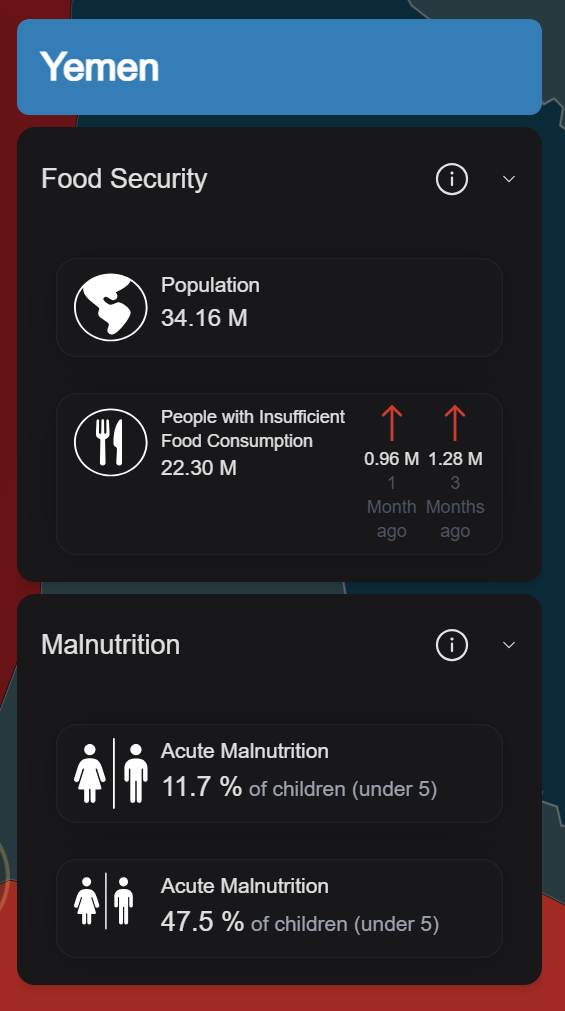
2. Country View
This view is displayed when a specific country is selected.
- The selected country is highlighted with detailed IPC data, while regions without available data are shaded in gray.
- Regions are categorized into 6 main phases, as indicated in the displayed legend:
- Phase 1: Minimal
- Phase 2: Stressed
- Phase 3: Crisis
- Phase 4: Emergency
- Phase 5: Famine
- Phase 6: Not Analyzed Data
- Includes two accordions displaying:
- Food Security
- Malnutrition

Technical Overview
The IPC Map is rendered using the IpcChoropleth component, which integrates two main subcomponents:
- World View: Handles global visualization.
- Country View: Focuses on a selected country's regions data.
1. World View
The World View is managed by the IpcGlobalChoropleth component, which serves as a wrapper for the GeoJSON component to display global IPC data. This view is loaded using the following key properties:
Data Processing with generateColorMap
The generateColorMap function is crucial for associating IPC data with map features:
- It maps IPC data to geographic features using their IDs.
- Processes the data into a format compatible with the
GeoJSONcomponent.
Here’s the function breakdown:
static generateColorMap = (ipcData: CountryIpcData[], mapData: CountryMapDataWrapper) => {
  const ipcDataById = Object.fromEntries(ipcData.map((data: CountryIpcData) => [data.adm0_code, data]));
  const updatedFeatures = mapData.features.map((feature: CountryMapData) => ({
    ...feature,
    properties: {
      ...feature.properties,
      ipcData: ipcDataById[feature.properties.adm0_id],
    },
  }));
  return { type: 'FeatureCollection', features: updatedFeatures as Feature<Geometry, GeoJsonProperties>[] };
};
This function ensures that IPC data aligns with geographic regions and prepares the data for visualization.
Layer Styling
Layer styling is managed using the style property of GeoJSON. Two cases are handled:
- World View: The layer is styled based on IPC data using a red gradient.
- This is handled by the
ipcGlobalStylefunction, which uses a switch-case structure to assign appropriate colors.
- This is handled by the
- Country View: Non-focused regions are styled in gray, while the selected country displays detailed IPC data.
Interactivity with onEachFeature
The onEachFeature property adds interactivity to map layers:
-
Tooltips: Populated by the
createTooltipfunction, displaying:- Country name.
- Date of analysis.
- Validity period.
- Severity and percentage of affected populations.
-
Mouse Events: Managed by the
attachEventsfunction, enabling:- Hover effects for highlighting countries.
- Tooltip display and hide functionality.
- Click events for selecting countries.
2. Country View
The Country View is managed by the IpcCountryChoropleth component, which serves as a wrapper for the GeoJSON component to display detailed IPC data for a selected country's regions. This view is loaded using the following key properties:
Data Processing
The fetchCountryData function is used to retrieve IPC region data for the selected country. This data is then processed to prepare it for rendering:
if (selectedMapType === GlobalInsight.IPC) {
  try {
    const newIpcRegionData = await countryRepository.getRegionIpcData(
      selectedCountryData.properties.adm0_id
    );
    const hasIpc = newIpcRegionData.features.some(
      (feature) => feature.properties?.ipcPhase !== undefined
    );
    setIsDataAvailable(hasIpc);
    if (newIpcRegionData && newIpcRegionData.features) {
      setIpcRegionData({
        type: "FeatureCollection",
        features: newIpcRegionData?.features as GeoJsonFeature<
          Geometry,
          GeoJsonProperties
        >[],
      });
    }
  } catch {
    setIsDataAvailable(false);
  }
}
Layer Styling
Layer styling in the Country View is managed by the fillCountryIpc. This function assigns styles to regions based on their ipcPhase level. Non-focused regions are displayed in gray, while the selected country's regions are color-coded according to their IPC phase.
Interactivity with onEachFeature
The onEachFeature property adds interactivity to the regions within the selected country:
- Hover Effects: Managed by the
attachEventsRegionfunction, enabling:- Highlighting of regions when hovered.
Accordions
Two expandable accordions are displayed based on the selected country:
- Food Security
- Malnutrition
These accordions are generated using the getFoodSecurityAccordionItems function. They display information such as:
- Country population.
- Number of people with insufficient food consumption.
- Percentage of acute malnutrition in children.
If no data is available, a No data available message is shown.